The Stats the Pros Use to Interpret the Market
As information about East Bay real estate proliferates from sources such as Zillow and Redfin, it’s increasingly difficult to know which metrics to focus on and why, and which are the most relevant.
With that, we want to outline the five core real estate metrics to best analyze the market. These are what the Red Oak team uses when we begin our market analysis for our clients.
A caveat: Numbers are not hard facts. Data is simple; interpreting it is difficult. To really understand market trends and to get an accurate picture of what to expect going forward, you need a deep understanding of underlying dynamics. More on that below.
While working with someone who can help interpret complex real estate stats is important, it doesn’t mean that you can’t understand broad aspects of the market on your own. In fact, we encourage all of our clients and contacts to monitor the market and to remain informed.
Number of Sales
A market’s total sales shows its activity. This number relates to a critical element of real estate data analysis: are there enough transactions to uncover a trend? If there are less than 10 transactions for a data point, any broad conclusions you try to draw could be misleading.
After reading this article, come back and play with this interactive East Bay real estate data chart to customize your own data searches. Source: Red Oak Realty
For example, when we look at median price points, we may need to include more than one month’s worth of sales. We often need to aggregate these numbers by quarter or even by year to ensure we have enough volume to uncover actual trends and not just random blips in the market.
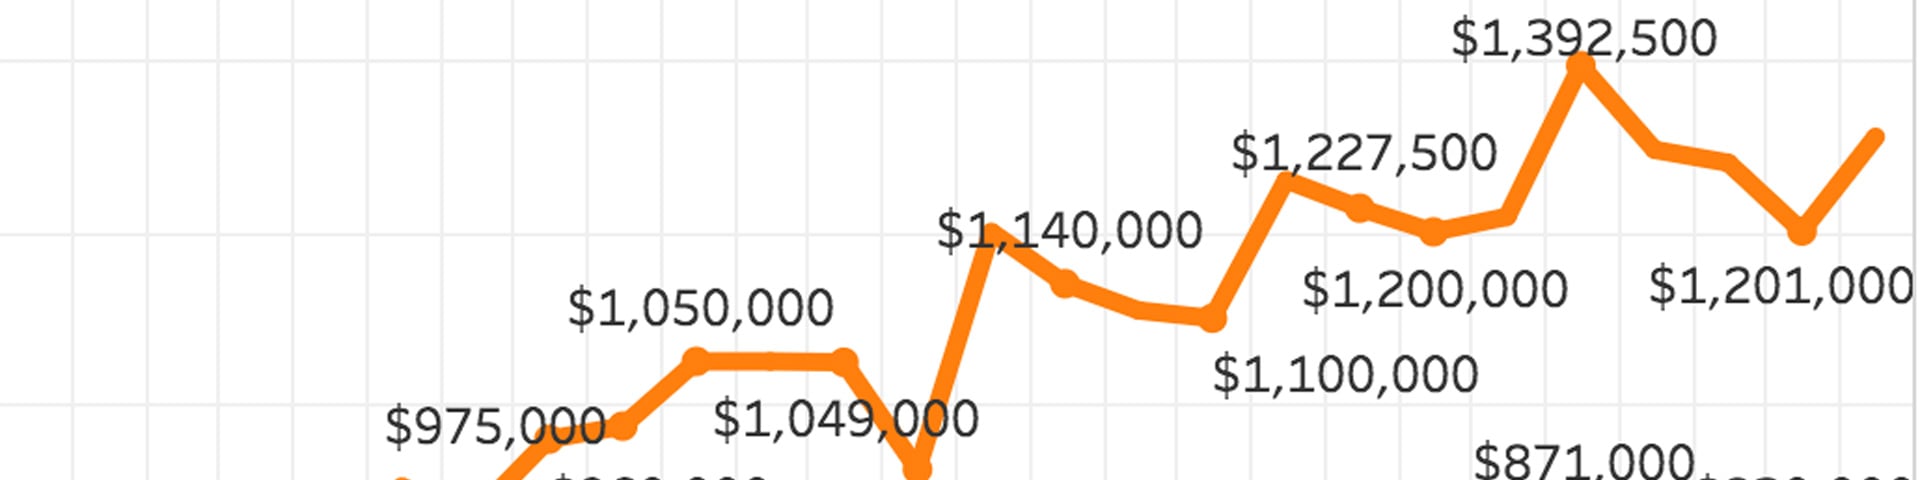
Median Sales Price
Average sales prices can skew a proper market analysis as extreme outliers -- such as a $10 million super luxury home or a $100,000 foreclosure -- disproportionately shift the averages.
Median prices reflect the midpoint of a frequency distribution, which gives us a more accurate reflection of what’s actually happening for most homes in the market.
Something to note: sales price does not become visible until a property closes, so this analysis only applies to closed properties, not those under contract.
Average Price per Square Foot
Looking at a market’s average price per square foot removes noise. If done properly, it allows us to compare home prices in an apples-to-apples way. This can really make comparisons clearer by allowing us to focus on the perceived value of homes themselves, aside from extras such as location and amenities.
Homes have many features: bed and bath combinations, garages or street parking, yards, etc. Average price per square foot strips these sometimes extra considerations away, allowing us to compare homes purely on a price perspective.
This also allows us to compare the “bang for buck” by comparable neighborhoods.
It’s important to note that smaller properties typically have higher prices per square foot, which is why it’s important to compare similarly sized properties.
A price-per-square-foot comparison also sheds light on a neighborhood’s trend line. By observing how price per square foot has performed over a period of time, we get a clear understanding of a neighborhood’s real estate trend line.
One important note: analyzing just price per square foot can be overly reductive. Be sure to assess it as part of a fuller real estate evaluation.
Average Percent of Price Over Asking
This metric reveals a market’s heat.
If a market has a high average percent of sales price over list price, buyers are competing for homes by bidding prices up above original list price.
The East Bay has seen this in spades in recent years.
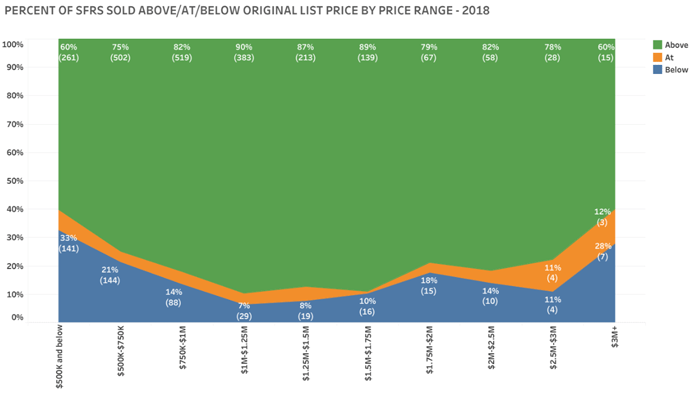
East Bay single-family homes at all price ranges consistently sell over list price. Source: Red Oak Realty analysis of MLS data.
We calculate this metric by the price of the home for listed in the MLS versus the sale price and is usually reflected as a percentage, such as 11 percent over asking or 2 percent below asking.
Real estate agents monitor a market’s list-to-sale price by home type and neighborhood to best understand how to price a home to entice a buyer bidding frenzy if they represent a seller and what price to offer to help buyers win a home at the lowest price.
Something to note: a listing strategy often employed in the East Bay is to purposefully underprice a home to encourage more buyers to place offers and encourage a bidding war, which pushes the sales price up.
Average Days on Market
The quicker homes sell, the hotter the market. The longer they take, the cooler the market. This one is fairly straightforward.
In the East Bay, homes typically go on the market with two back-to-back weekends of open houses.
On the Tuesday after the final open house, the seller and listing agent typically review all offers and then, if they find an acceptable one, choose one. Every market has its own cadence. This is the typical East Bay one.
So if a home sells quickly in the East Bay, it’s usually at the 14- to 21-day mark.
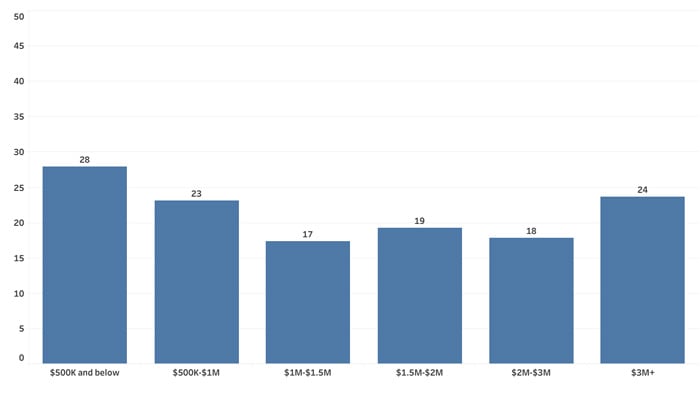
East Bay single-family homes at all price ranges consistently sell quickly as 2018 data above shows. Source: Red Oak Realty analysis of MLS data.
Bonus: Seasonality
Most people know that the real estate market fluctuates seasonally, but may not know how critical it is to account for this fact when analyzing real estate data.
The market follows a fairly consistent seasonal trend marked by median home prices.
Prices are:
- lowest in the first quarter
- highest in the second quarter
- lower in the third quarter
- next lowest in the fourth quarter.
This fairly consistent pattern requires us to perform year-over-year comparisons for accurate analysis.
How to Interpret the Data
With all the data at our fingertips nowadays, deciphering it and making intelligent, smart decisions become increasingly complicated, and important.
Smart home decisions require not only objective real estate data, but incredibly deep, nuanced insight into specific East Bay neighborhoods and a clear-headed analysis of each real estate consumers’ goals and needs.