
If you’ve peeked at the East Bay real estate market over the past few months, you know that activity has been intense. Multiple records were broken in the spring, from the highest median price ($1.1M) to the lowest days on market (14 days).
But now that we are in the fall market, we are dealing with fairly different dynamics. As is typical after Labor Day, there are many more listings for sale, which means sellers have more competition and buyers have more to choose from. This also means that the market is behaving unevenly, with some listings seeing multiple offers and high prices, and others with diminishing open house traffic and missed offer dates.
These differences are hard to surface in data because the variations in each property are driven by so many factors, but if we look back at East Bay market stats for the third quarter of the year (July through September), we see that the market has not been performing consistently for all listings.
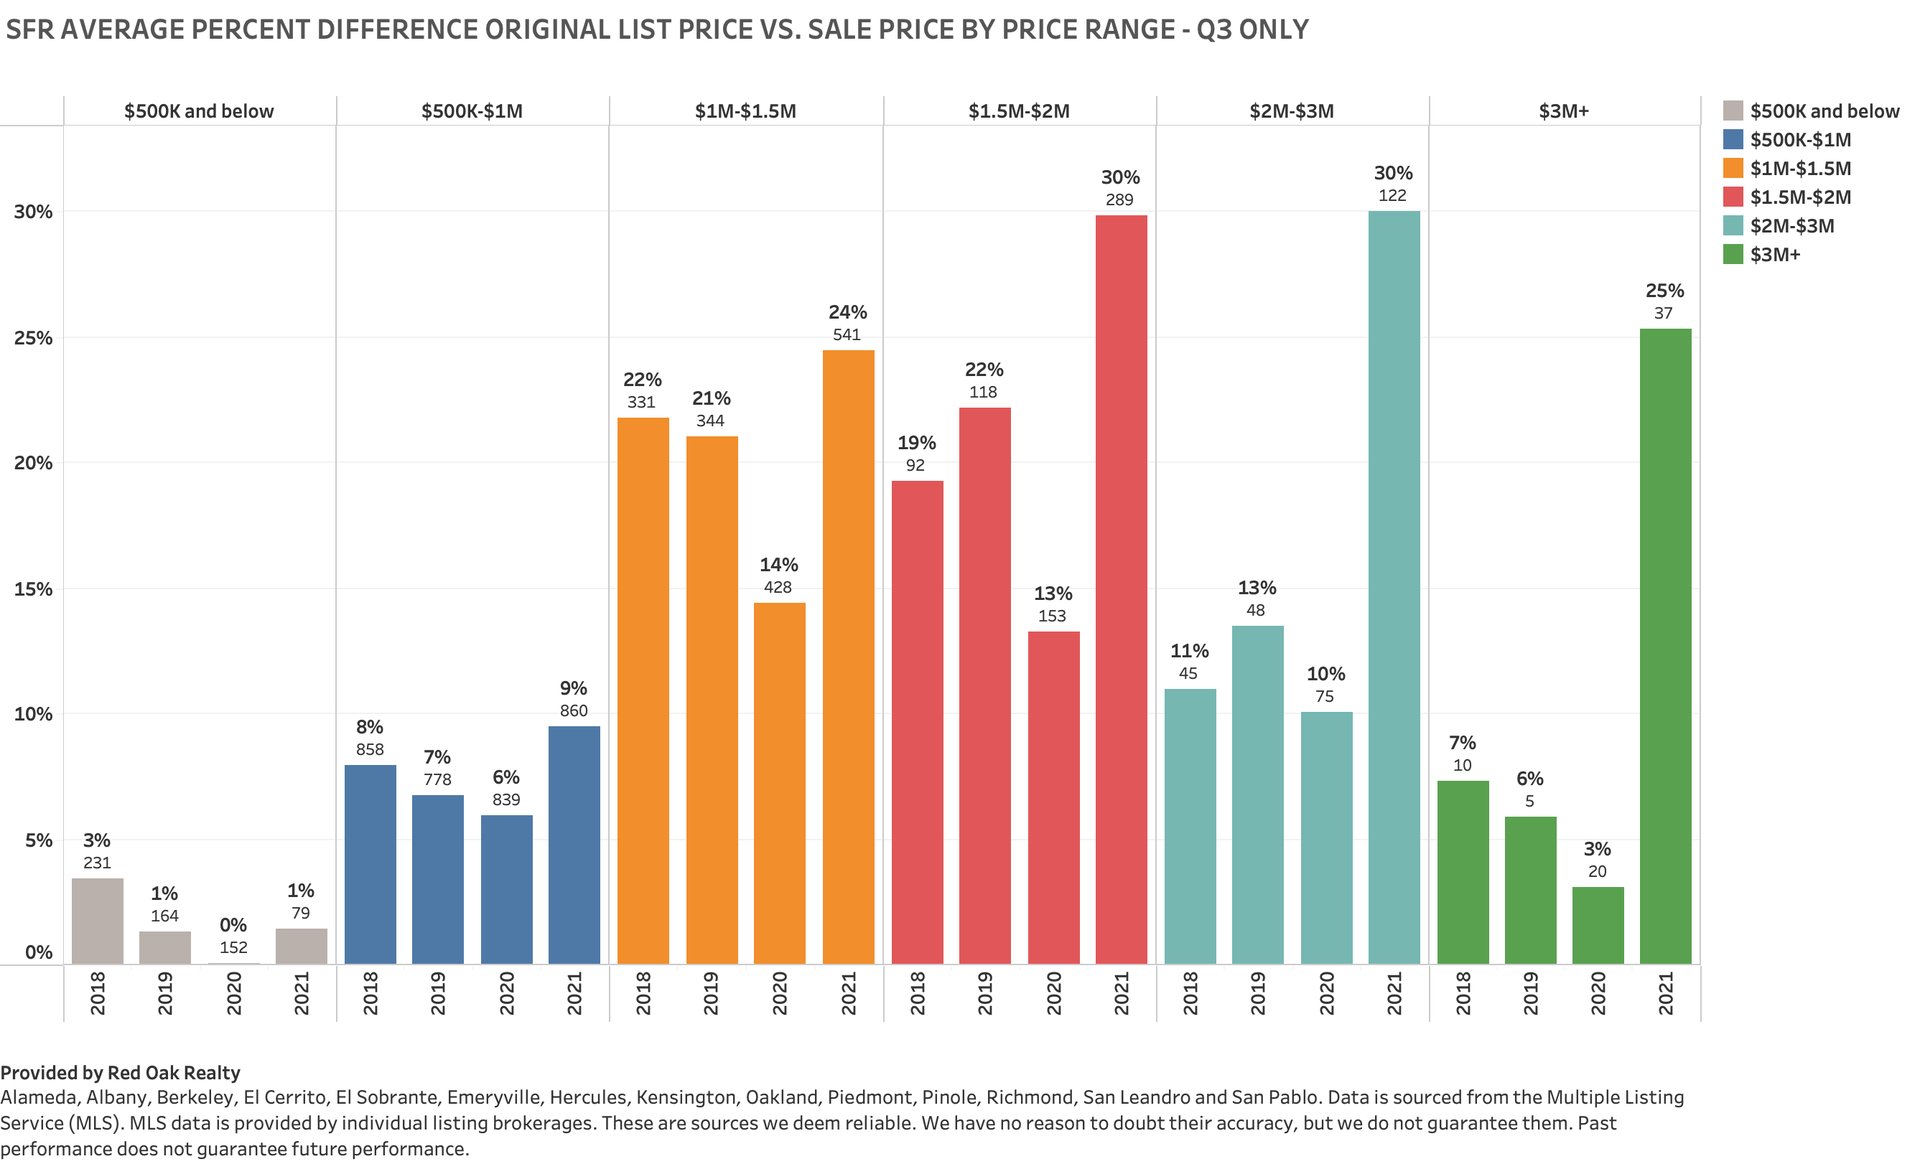
For example, below you will see the percent difference between list and sale price by sold price range. You’ll see that the lower the price, the closer to list the property is likely to sell. This tops off at 30% over list in the $1.5M-$3M price range.
Why the discrepancy? Likely because lower-priced listings have factors that reduce the property’s attractiveness, from not appearing to be move-in ready to deferred maintenance, and potentially an unrealistic list price.
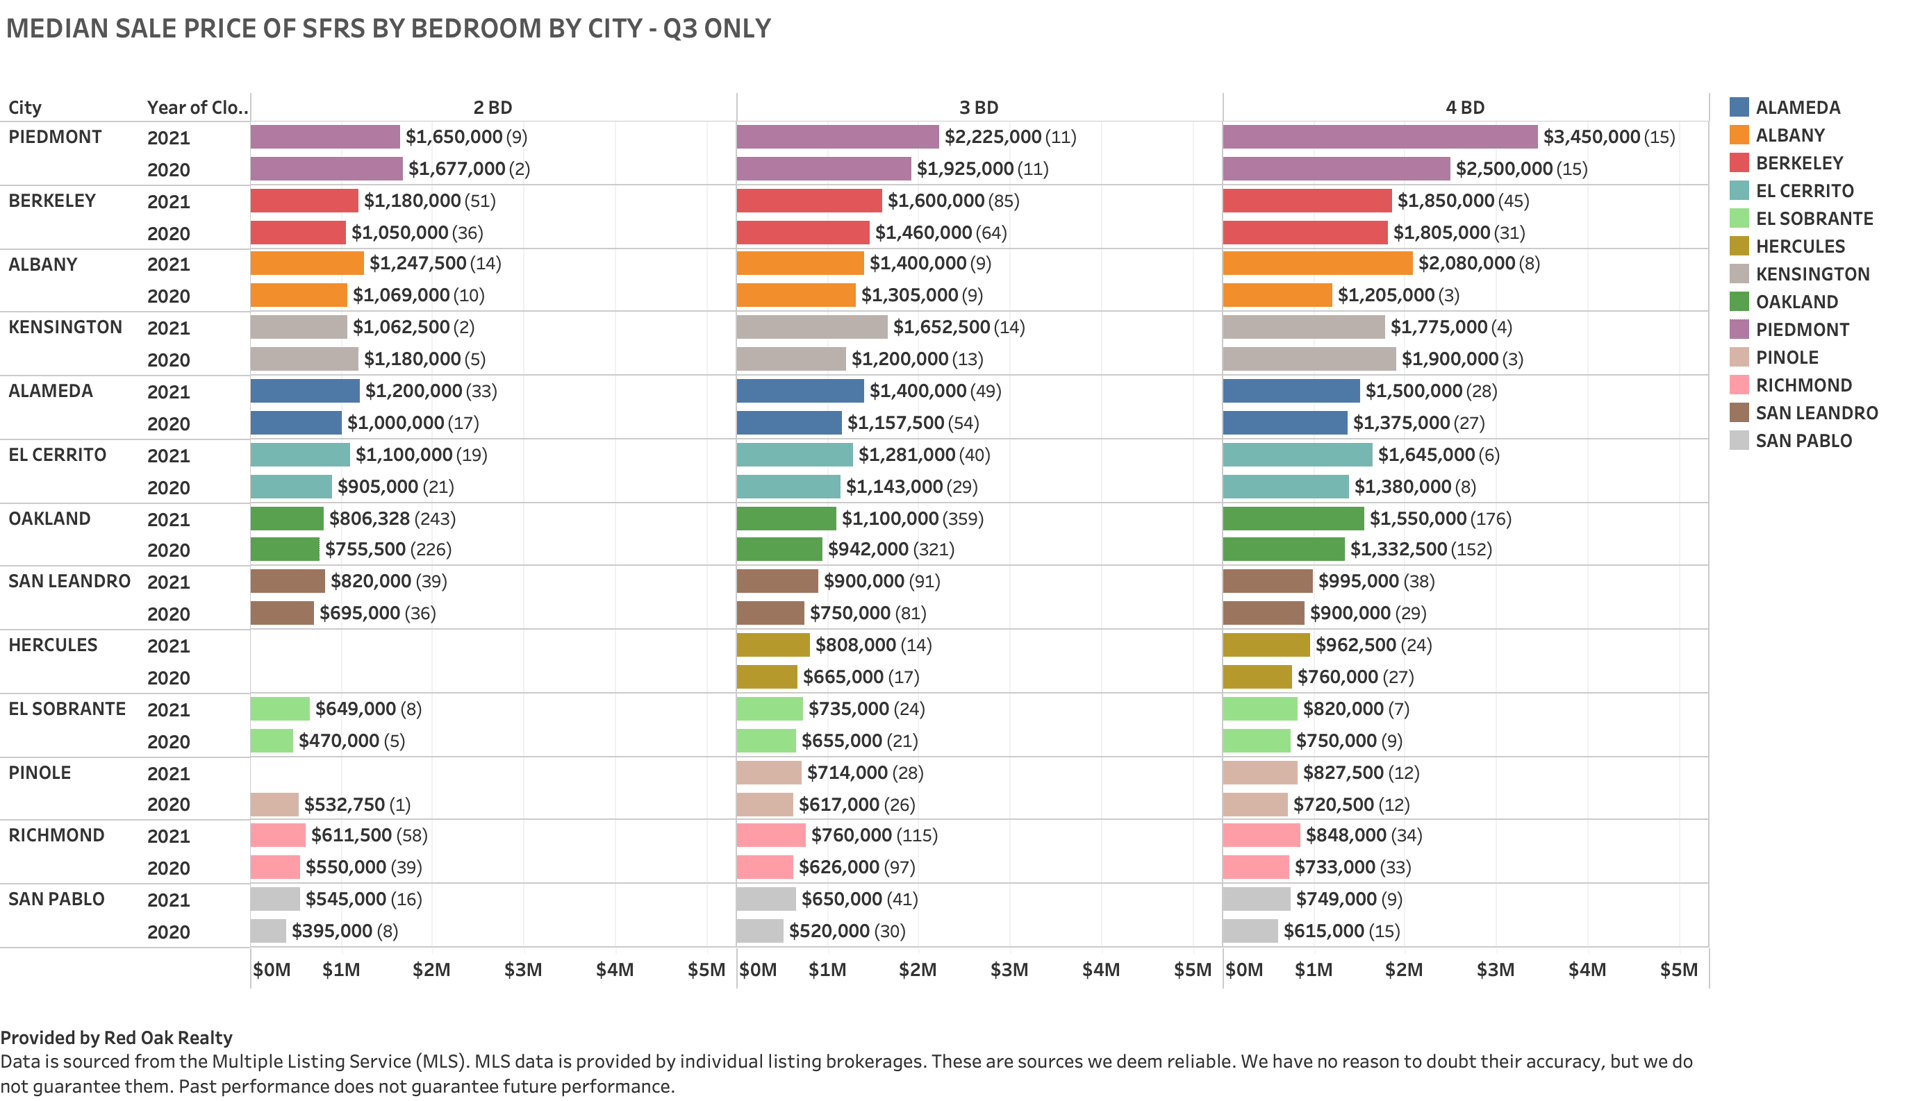
Looking at median price by city and by bedroom count, Piedmont and Berkeley continue to lead the pack. Some cities might be hiding undervalued properties; for example, Alameda tends to be the fifth most expensive city in the Inner East Bay, but its 4 bedroom properties have a comparatively lower median price.
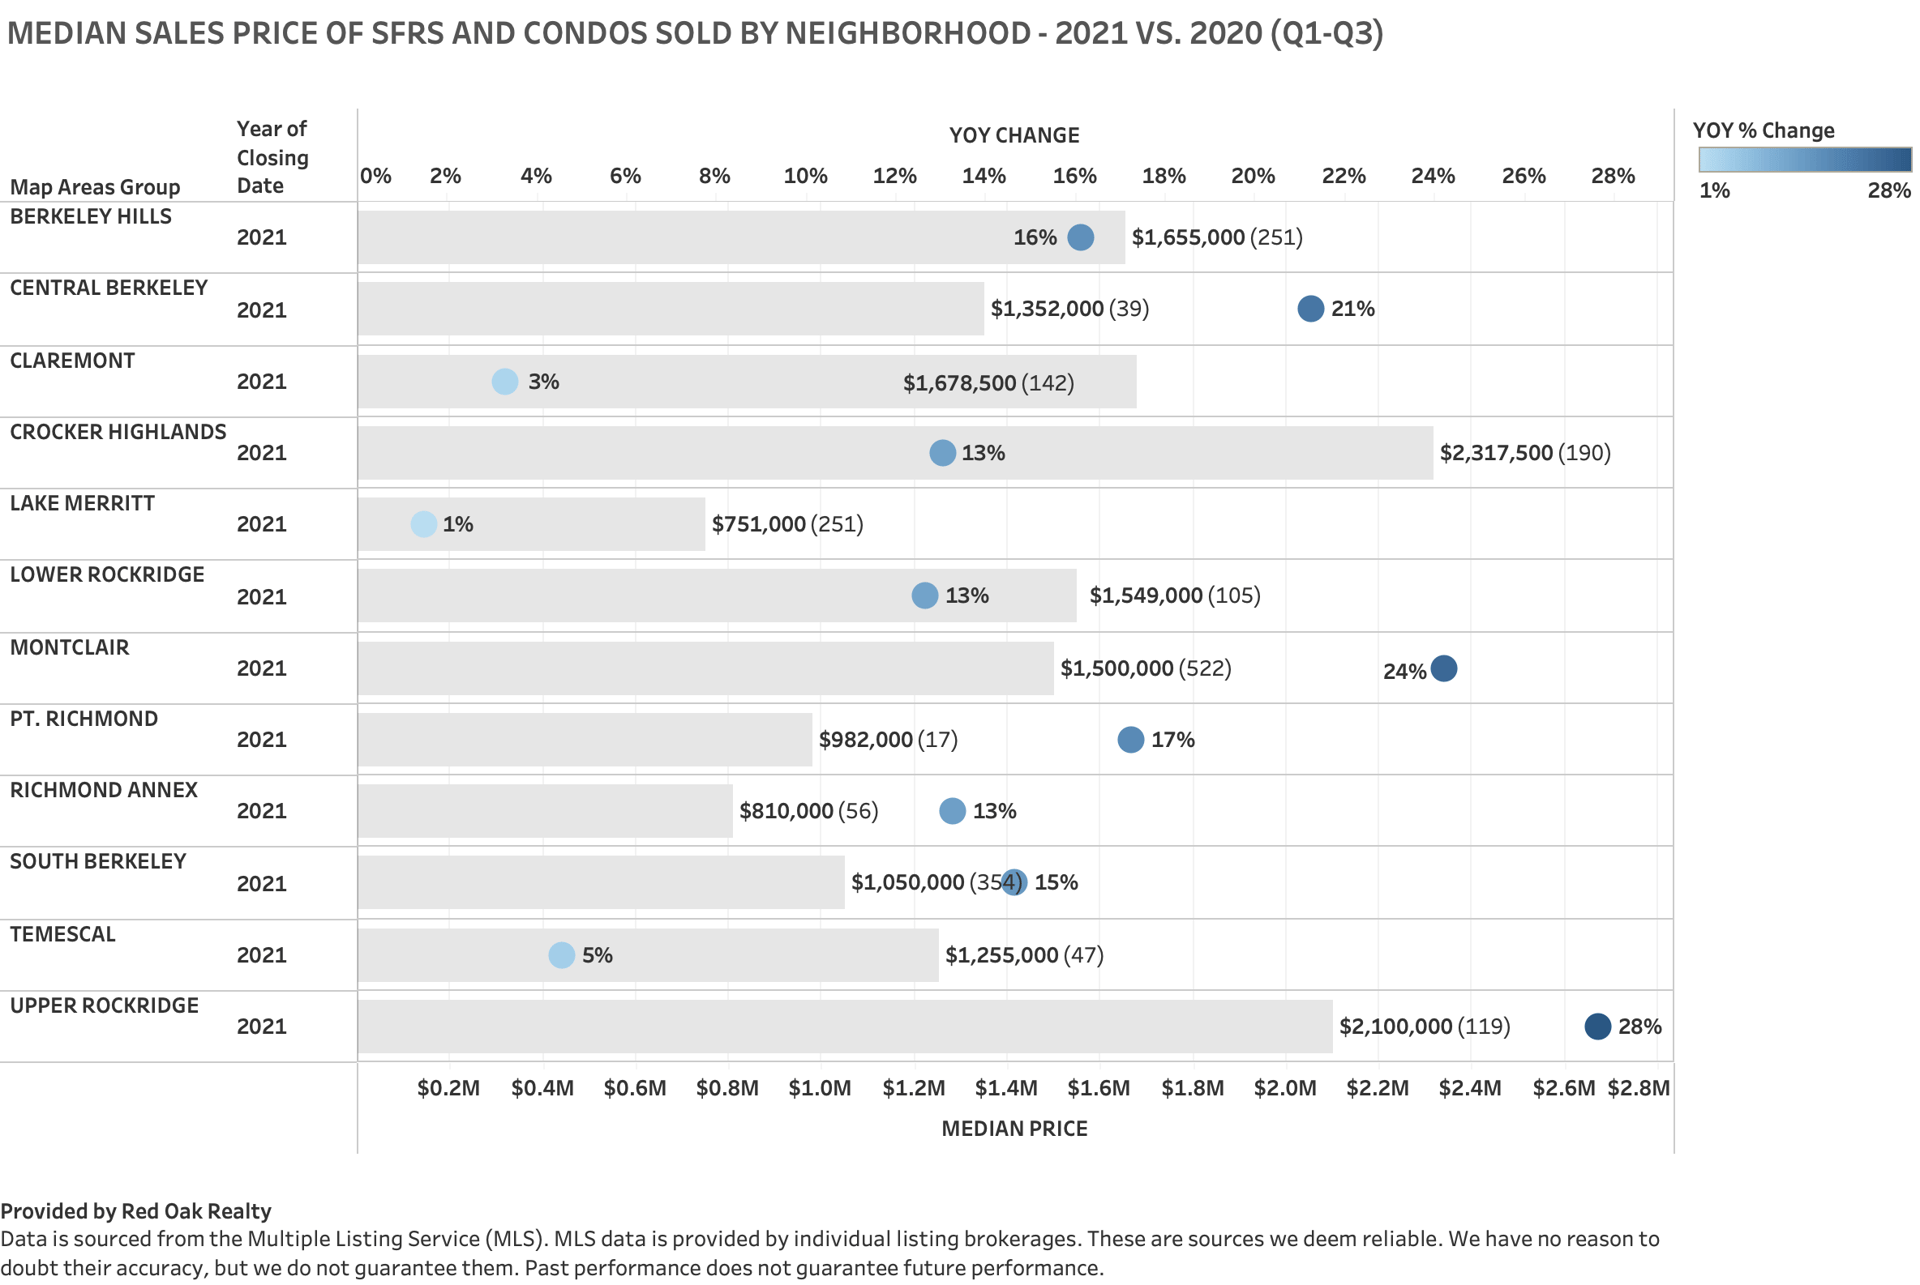
If we zero in on some of the most popular neighborhoods in the Inner East Bay, we find that some are appreciating faster than others. For example, Claremont, Lake Merritt and Temescal are experiencing single-digit appreciation compared to listings in Upper Rockridge and Montclair (28% and 24% appreciation, respectively).
This doesn’t mean that all properties in the lower-appreciation neighborhoods are underperforming. It just means that the most competitive buyer activity may be focused on particular neighborhoods.
These charts are broad brush strokes, and individual experiences can vary greatly. You can dig a little deeper using our 85-page market report here. If you would like a customized report to see how the current market matches with your goals, just reach out to your Red Oak agent.