
As you may have read - or encountered first-hand - the East Bay real estate market is currently experiencing significant changes. Buyer demand, which had been softening for months, experienced a hard stop in early June and continues to slow even further in July. The change was mainly driven by spikes in inflation, uncertainty driven by rounds of tech layoffs, and increasing interest rates (and thus decreasing buying power).
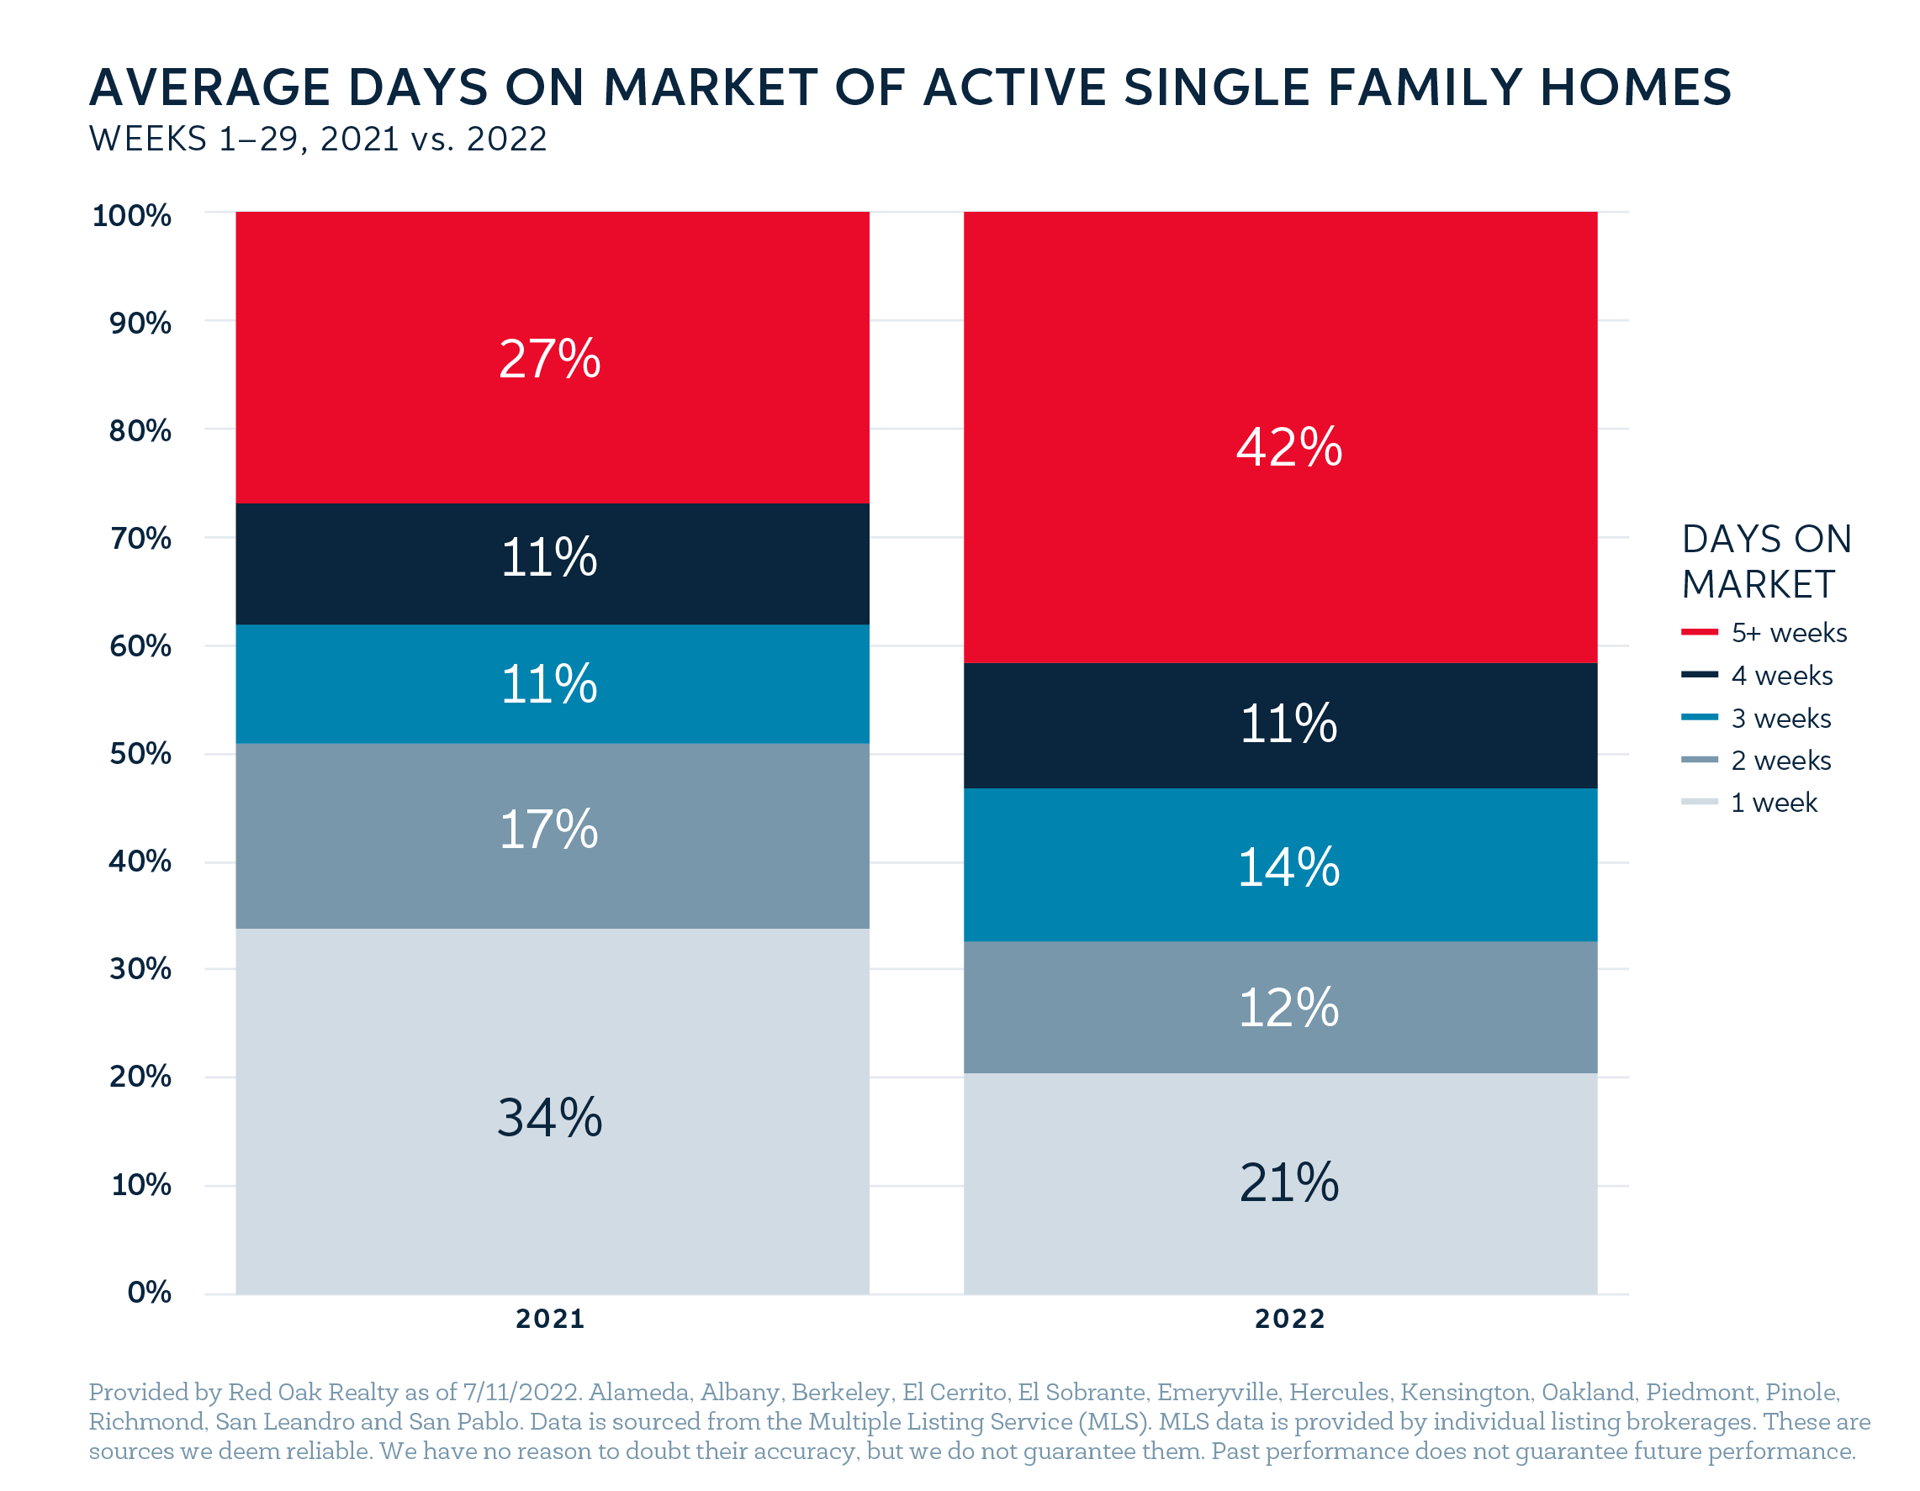
Although buyer activity has been falling, new listings continue to hit the market, creating an imbalance between supply and demand. As a result, key metrics in the East Bay are faltering, driving down median price as well as the amount buyers are willing to pay over the list price, while driving up days on market. For example, looking at active listings by the length of time they have been on the market, 42% of properties have been active for 5 weeks or more; at this time a year ago, only 27% reached this threshold.
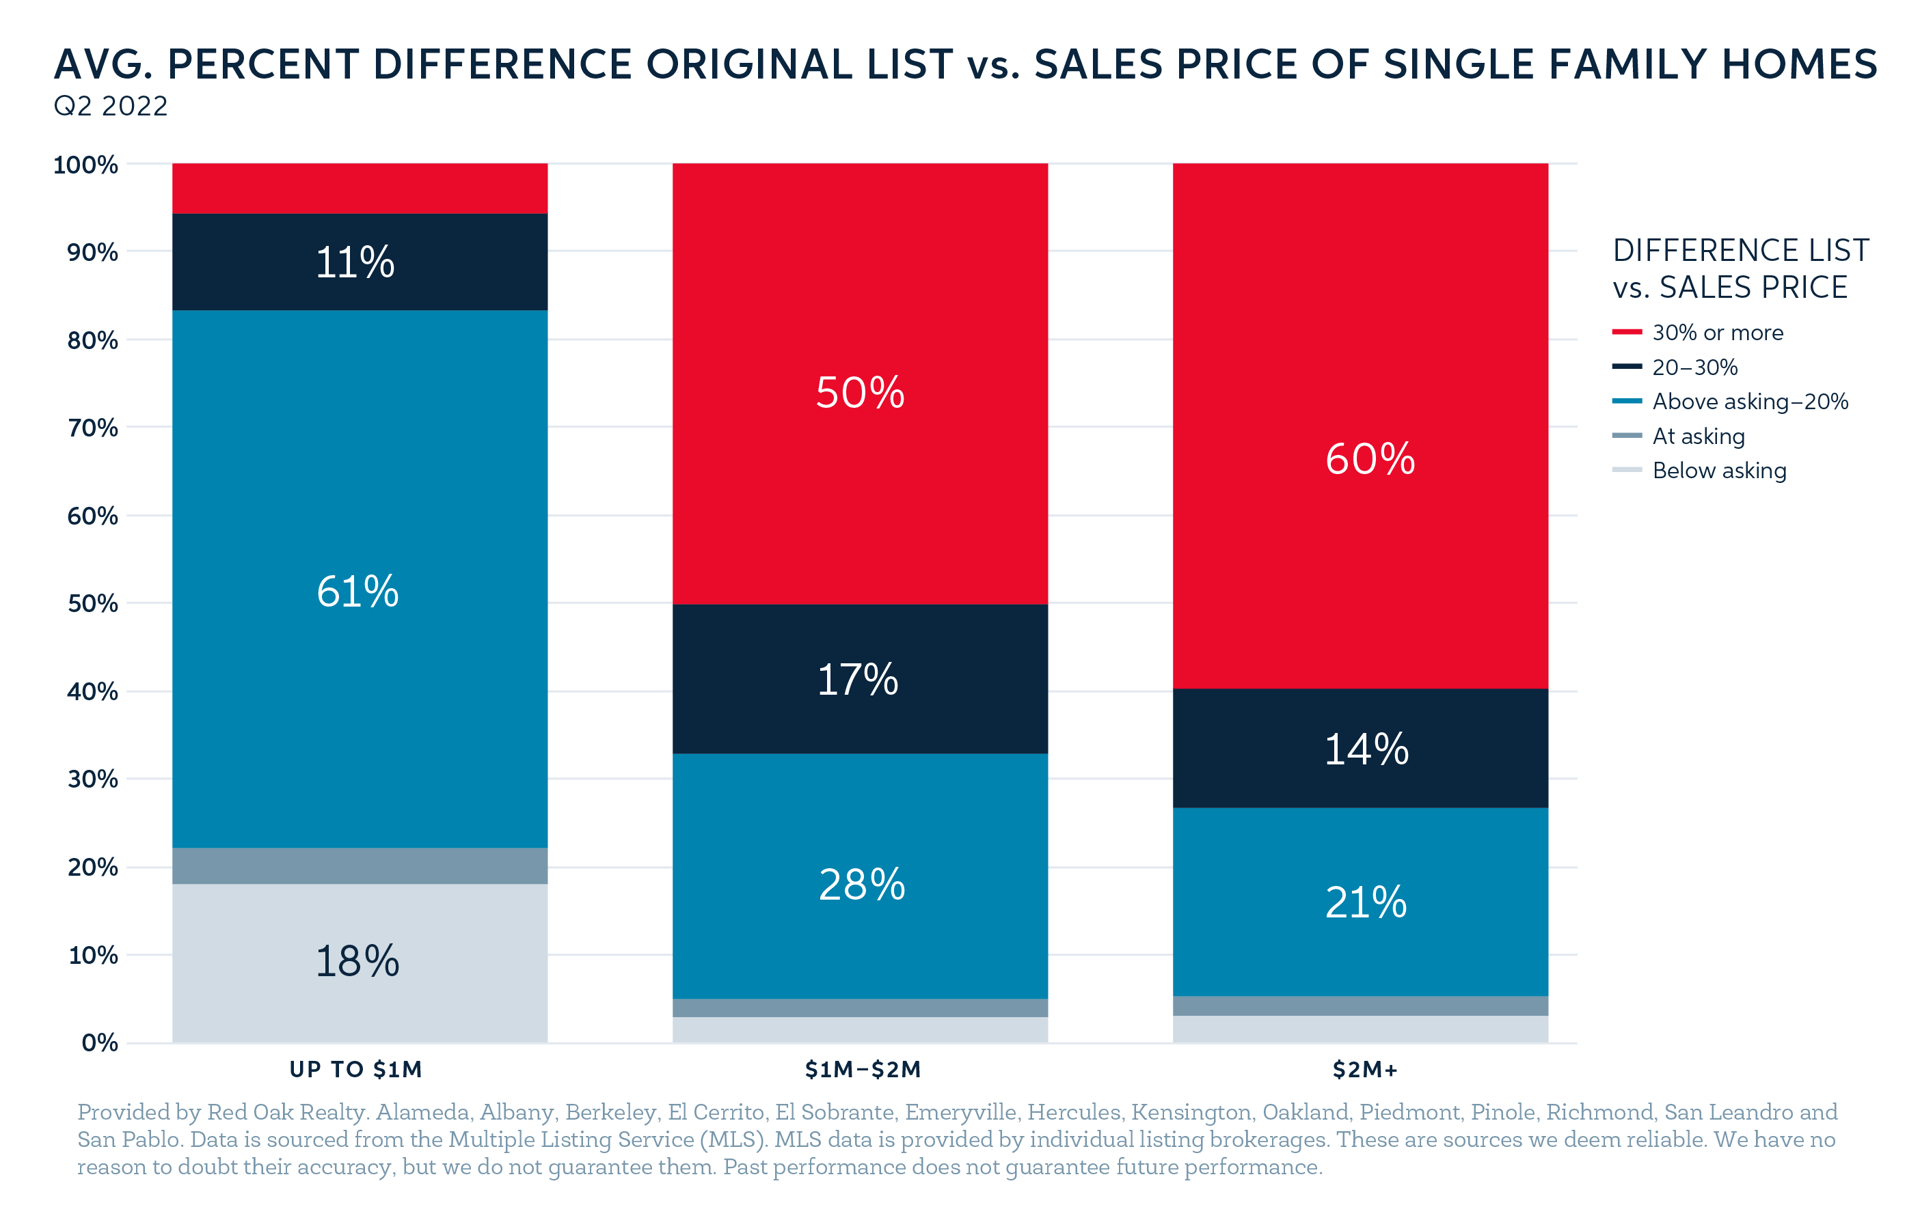
However, not all properties are being affected in the same way. Higher-priced properties are performing better than lower-priced properties. Those that are “most attractive” - desirable neighborhood, appealing design and “move-in ready” - are still generating a high level of interest from buyers. Indeed, when looking at properties that sold in Q2 2022, the higher the sale price, the further over asking the property tended to sell.
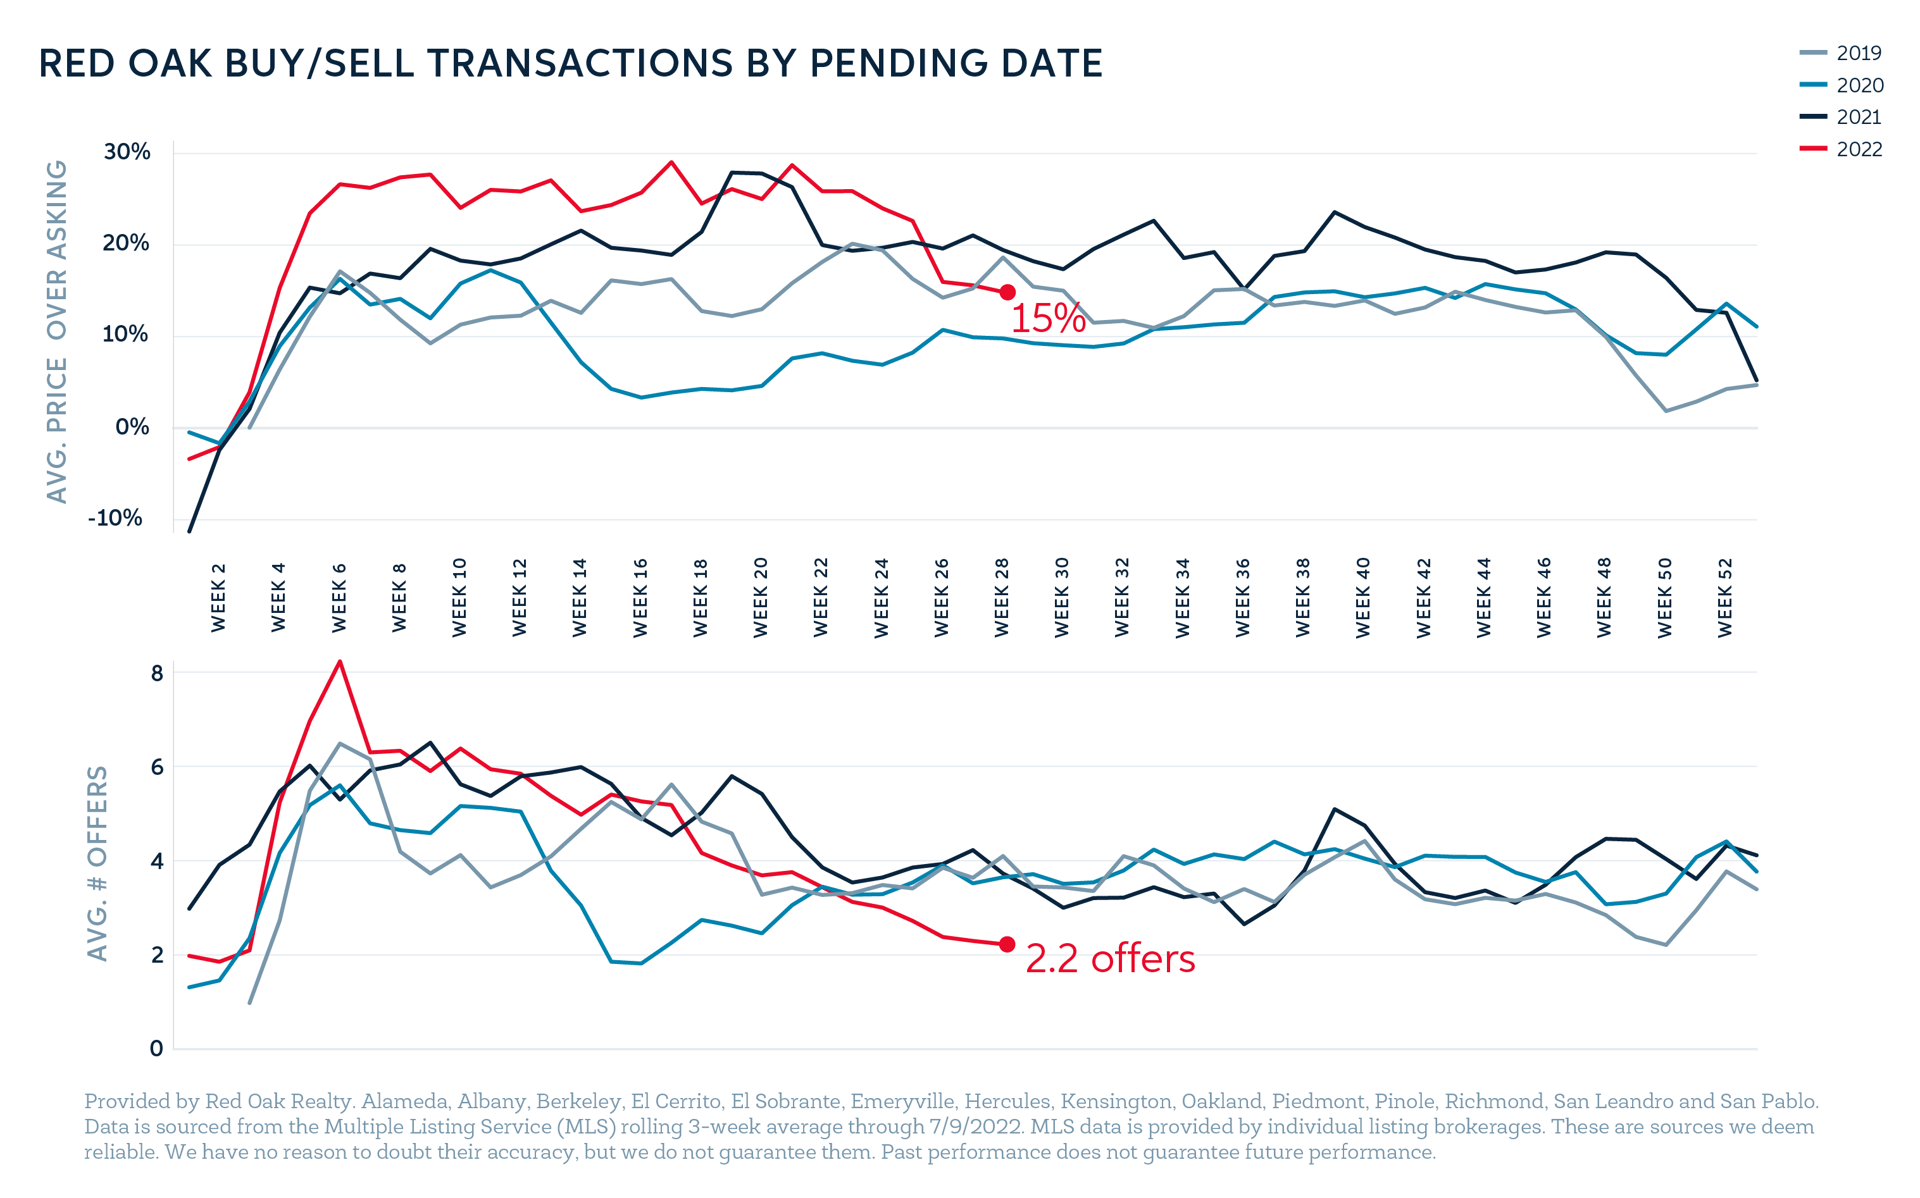
How is the future East Bay market unfolding? By analyzing Red Oak’s internal transaction data by offer date, we can see that the high level of inventory continues to take its toll. Homes are selling closer to asking (an average of 15% over list) and are attracting fewer offers (an average of 2.2, the lowest we have seen for this season since 2014).
This shifting market has put significantly more power in the hands of buyers - more than they have seen in over a decade - creating new opportunities to purchase at lower prices with terms that are more attractive to them. However, buyers are still writing aggressive offers: in June only 15% had an appraisal contingency, 18% had an inspection contingency, and 17% had a loan contingency.
As sellers and their agents navigate this market, they need to stay in tune with current conditions - which can change week by week - adjusting pricing and expectations accordingly.
For more information, please see this 95-page analysis of the Q2 2022 market and reach out if you would like a custom report related to your specific goals.