
The Inner East Bay real estate market experienced a busier than anticipated start to 2025. Single-family homes saw increased sales activity and a slight upward trend in prices. Conversely, the condo market showed an increase in the number of listings while the median sale price experienced a notable decline. Inventory levels may be on the rise however there are complexities to consider when digging deeper into the numbers.
Single Family Homes
For single-family homes, the overall median sold price saw a slight increase of 4.2%, moving from $945,000 in Q1 2024 to $985,000 in Q1 2025. The number of homes sold increased by 9.6%, and sold 10% faster, indicating a sustained demand in some areas of the East Bay market. Contributing to this was the average price buyers were willing to pay over the property's listed price (OLPSP). With a slight increase of 4.7% compared to Q1 2024, competitive bidding situations and multiple offers are still the norm in some neighborhoods.
Inventory & Cancellations
Increases in inventory are one way the industry determines how balanced the market is and whether the market is leaning toward buyers or sellers. A shift from 1.58 months in Q1 2024, to 2.18 months in Q1 2025 indicates that inventory is rising and buyers have more options, however we are still well below the 5 month supply that supports a balanced market.
Another significant change in Q1 2025 was the 35% increase in cancellations. This suggests any number of factors could be at play from issues with financing and inspections to buyers reconsidering. The fact that only 72% of listed properties sold in Q1 2025 (a 10% decrease from Q1 2024) implies that more homes did not find buyers or buyers and sellers could not come together on price.
Condominiums
In contrast to the single-family home market, the condo market saw a 12.5% decrease in the median sold price, from $600,000 in Q1 2024 to $525,000 in Q1 2025, despite a 7.3% increase in the number of listings. This suggests that increased supply in the condo market was likely a significant factor contributing to the downward pressure on prices. It could also indicate a shift in buyer preference away from condos or affordability constraints making condo buyers more price-sensitive.
Cities & Neighborhoods
At the city level for single-family homes, Oakland dominated transaction volume, accounting for 50% of all sales in the Inner East Bay. Cities like Piedmont and Alameda experienced significant increases in sales volume, while Berkeley, Hayward, and Richmond saw declines. Median sale price changes also varied considerably by city, with Piedmont experiencing the largest increase at 27% and El Cerrito the largest decrease (-7%). Another example of how local market dynamics can significantly impact price trends. Here are a few examples of how significant the year over year price changes can be at the neighborhood level:
|
Neighborhood
|
% Change Median Sales Price Q1 2024-2025
|
|---|---|
| Thousand Oaks (Berkeley) | +36% |
| Piedmont Pines | +32% |
| Claremont (Berkeley) | +29% |
| South Berkeley | +23% |
| Central Albany | -8% |
| Maxwell Park (Oakland) | -20% |
| Lower Rockridge (Oakland) | -17% |
| Upper Rockridge (Oakland) | -15% |
Over the long term, most Inner East Bay cities have seen substantial appreciation in median sale prices over the past fifteen years.
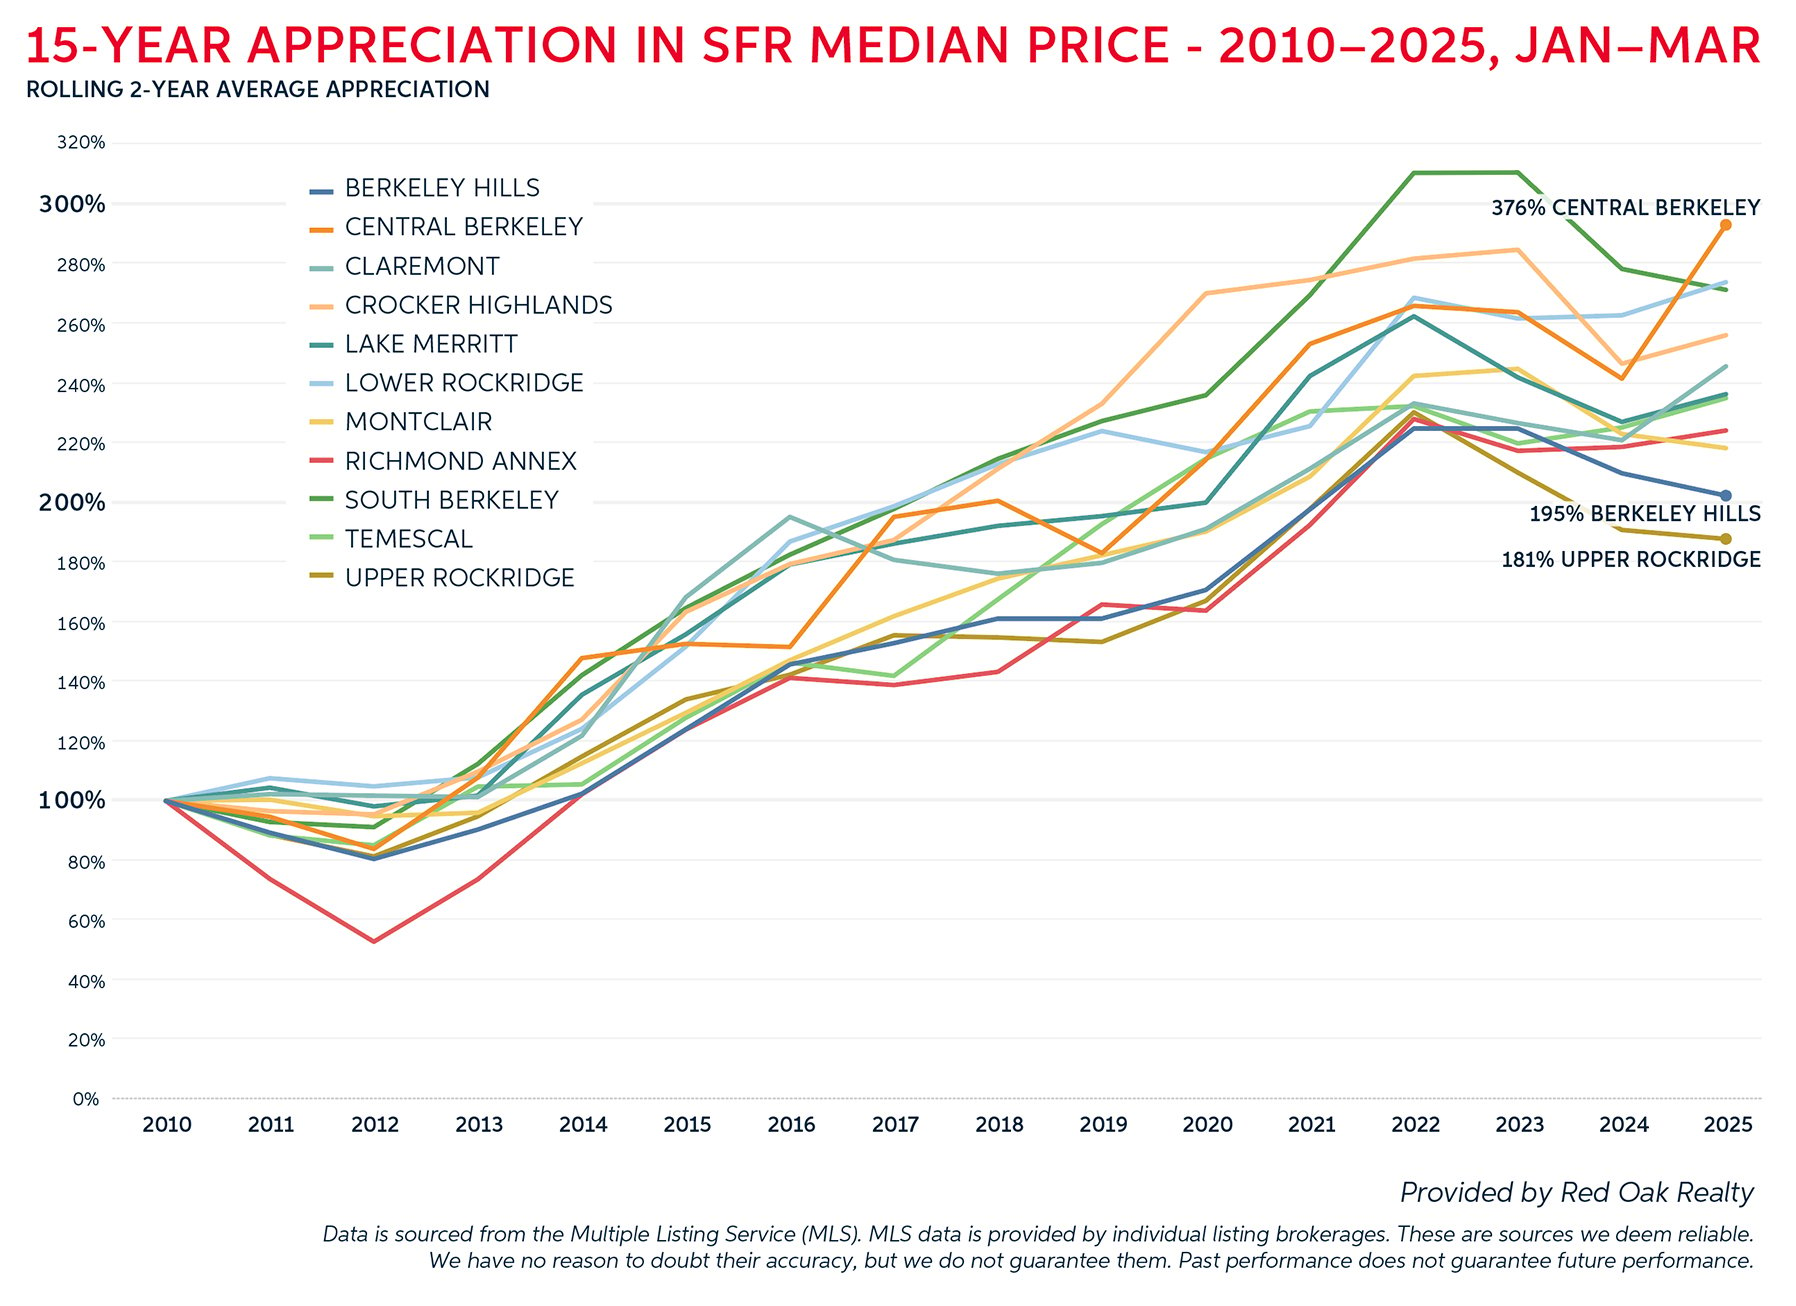
As always, reach out with any questions, or if you would like to discuss your real estate goals. If you'd like to see an appreciation chart for your neighborhood, respond to this email.