After two years of the pandemic, the number of new listings is growing - right in time for the spring market. Open house traffic has remained high and stable and we broke a record for price over asking.
However, the number of new contracts fell for the past two weeks. Is this because buyers have more listings to consider before writing an offer, or is it because of the increase in mortgage rates (4.88% conforming, 5.25% high balance, 4.75% jumbo), inflation (7.9% in February), war and gas prices?
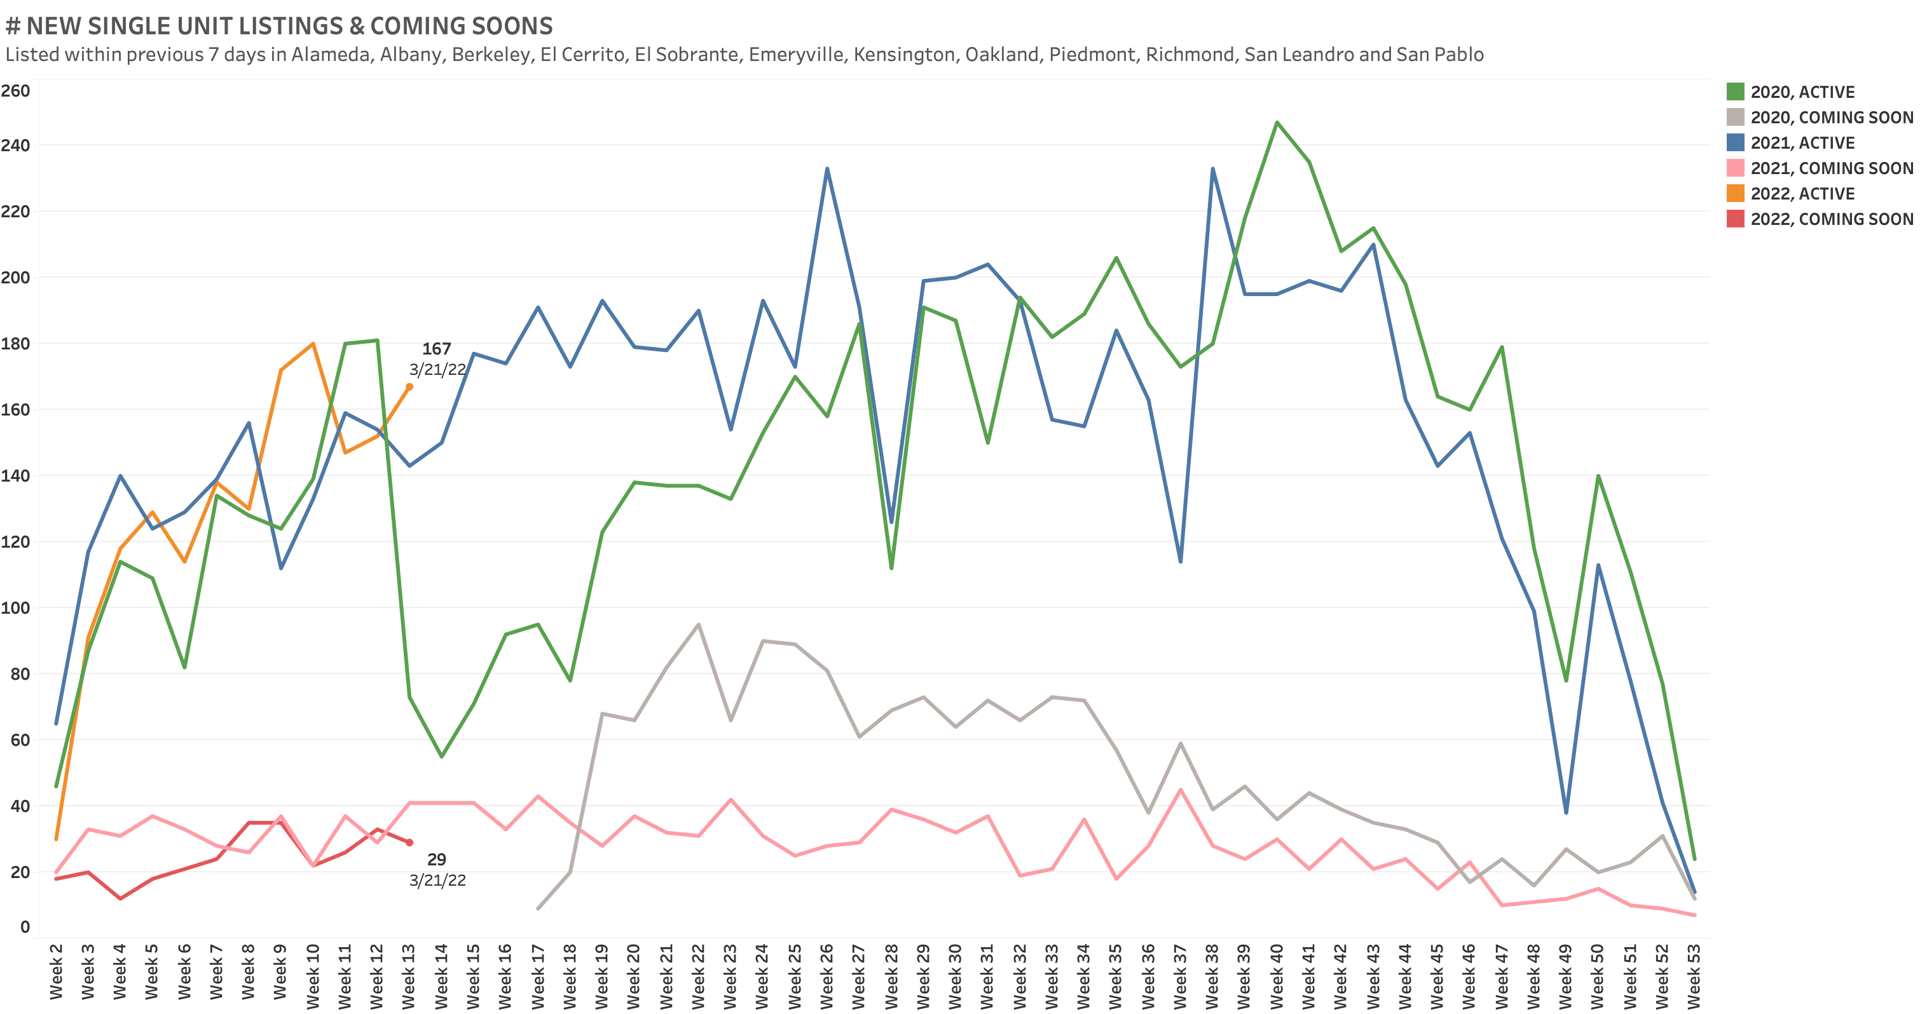
The number of new listings that come to market each week has been on the increase as we head into the spring market. This aligns with 2021 data as well as 2020 (until the pandemic, of course).
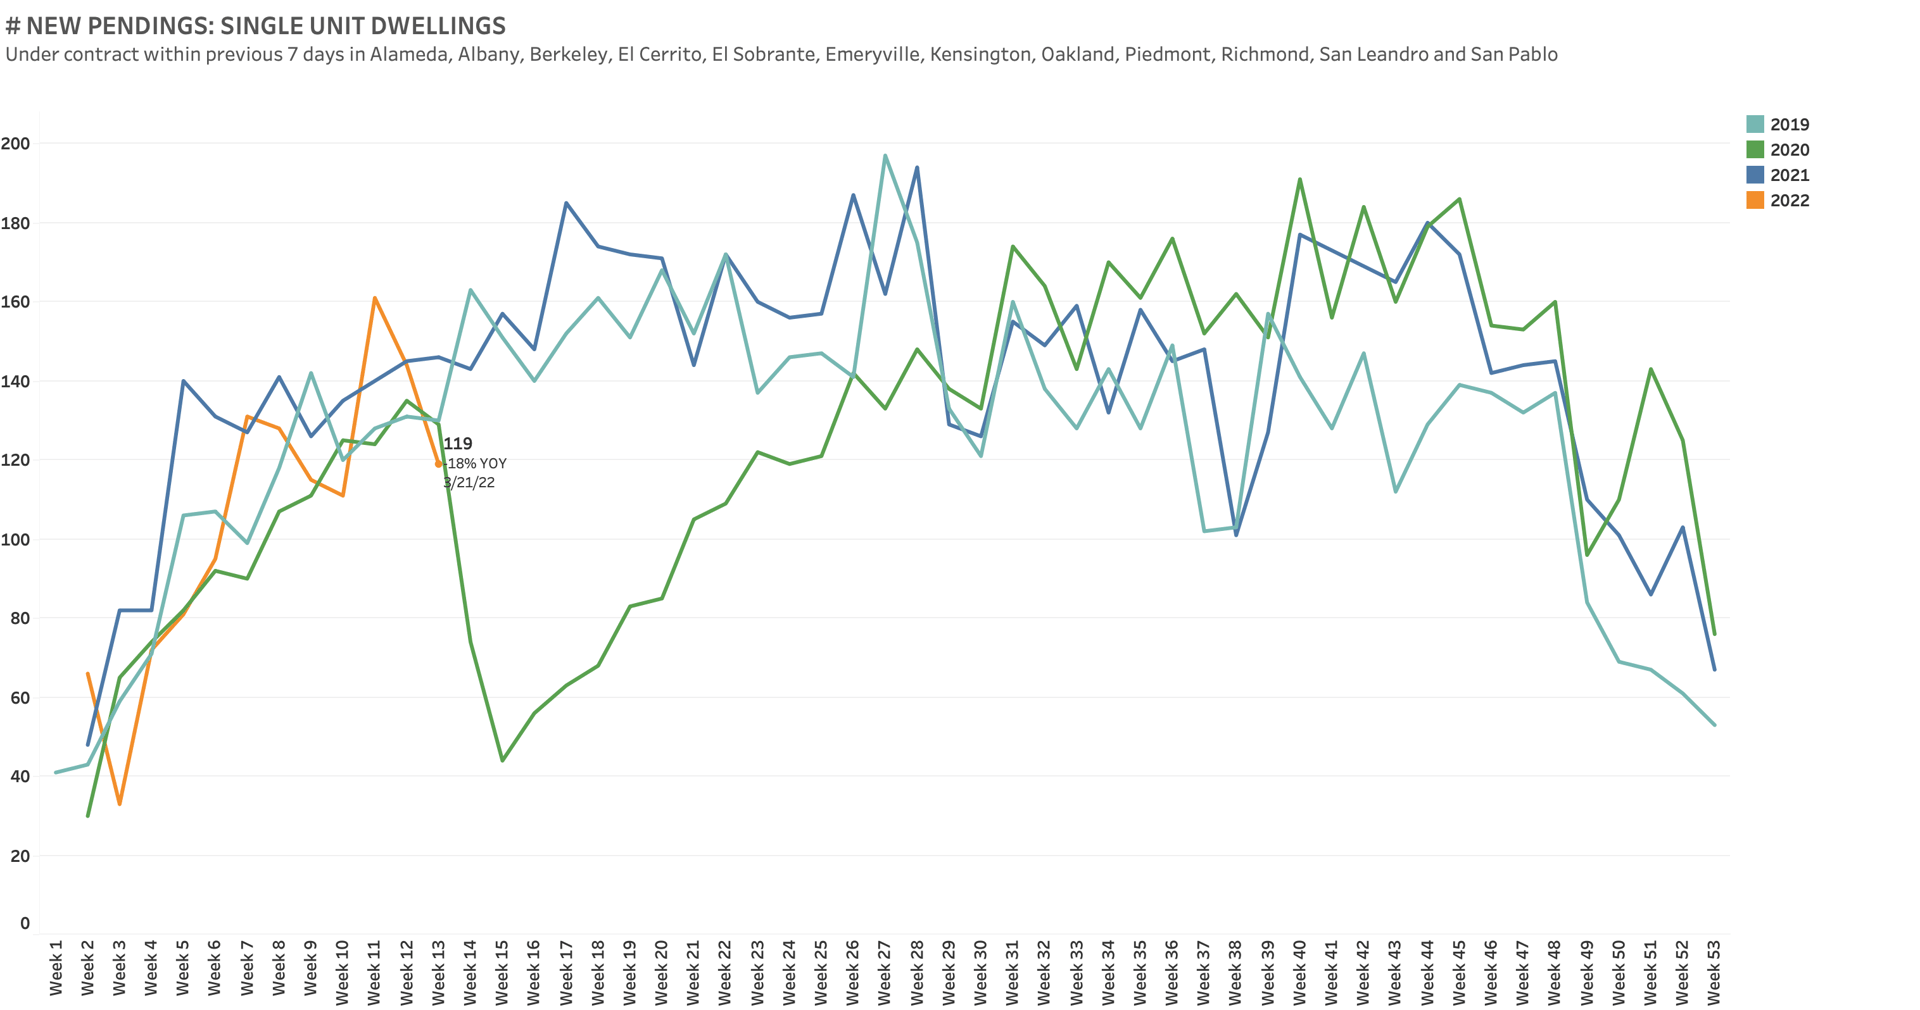
The number of new contracts fell for the past two weeks. Is this a concern, or do buyers suddenly have more listings to review before writing an offer?
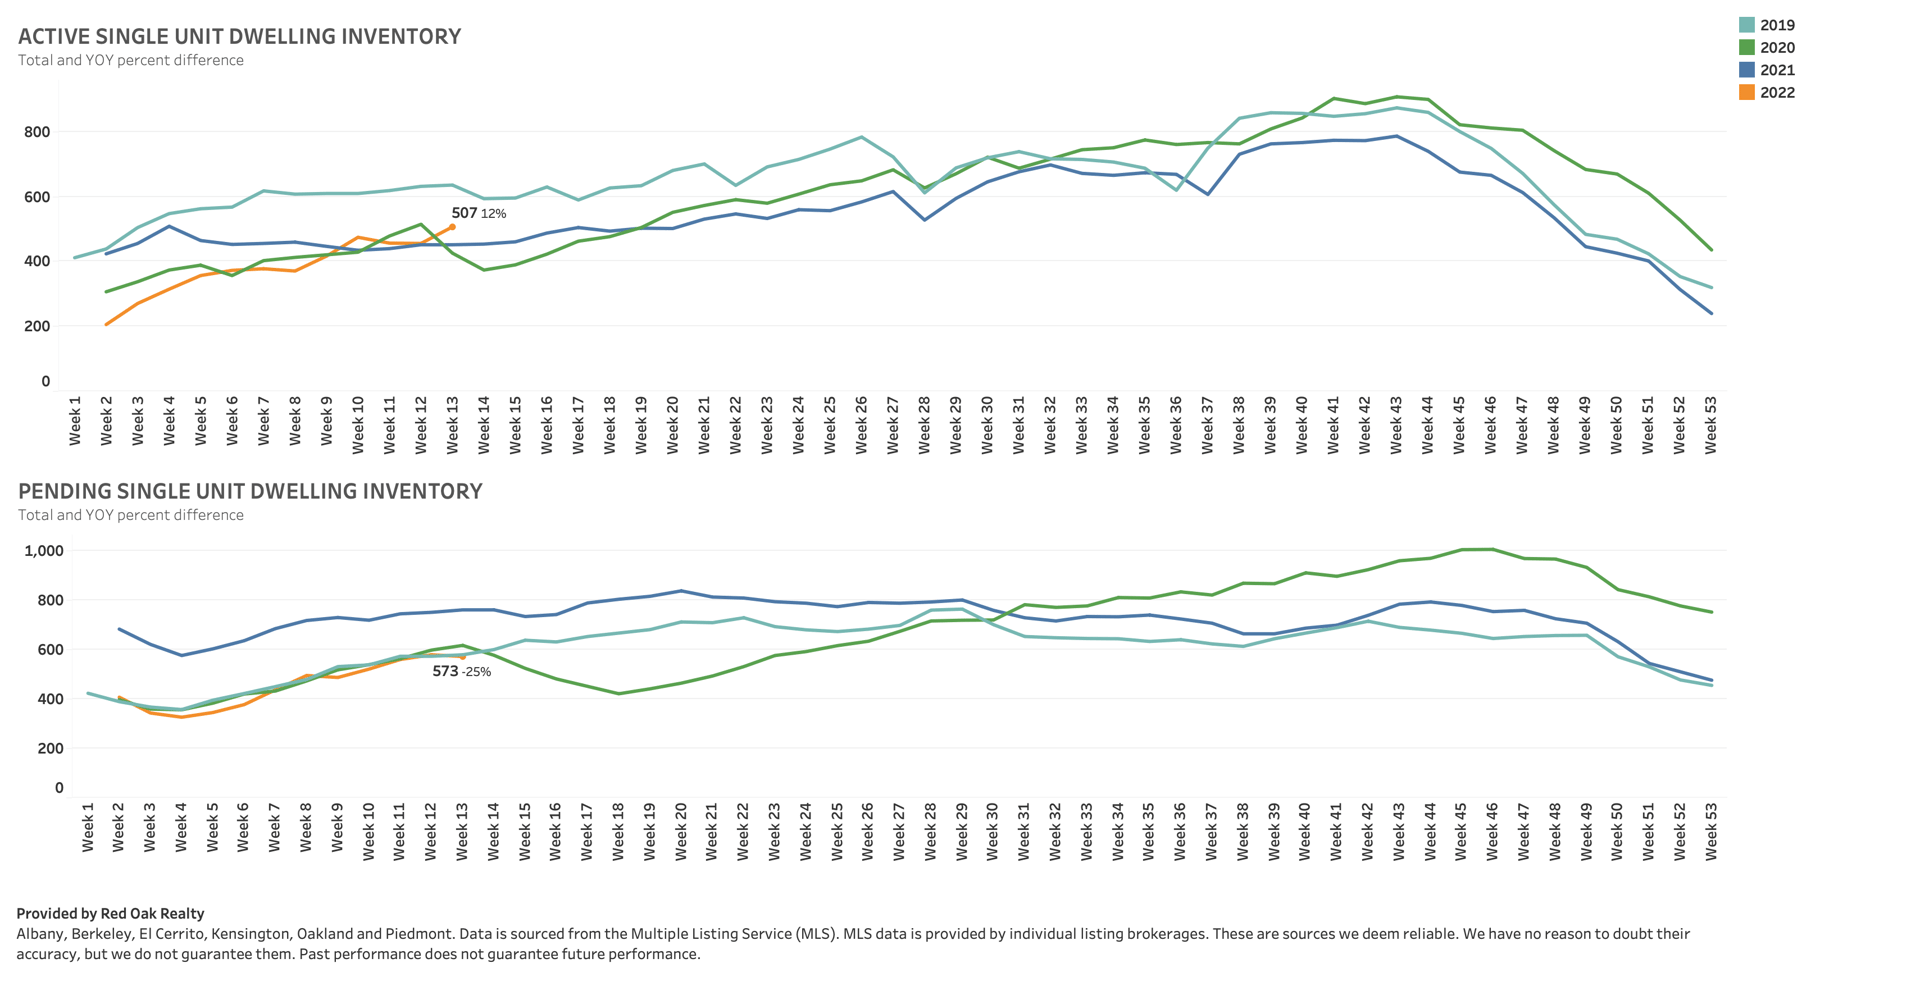
The number of all active listings is 12% higher than the previous year, which means buyers now have more to choose from. However, there still isn't enough inventory to meet demand, with the number of active listings 20% lower than 2019.
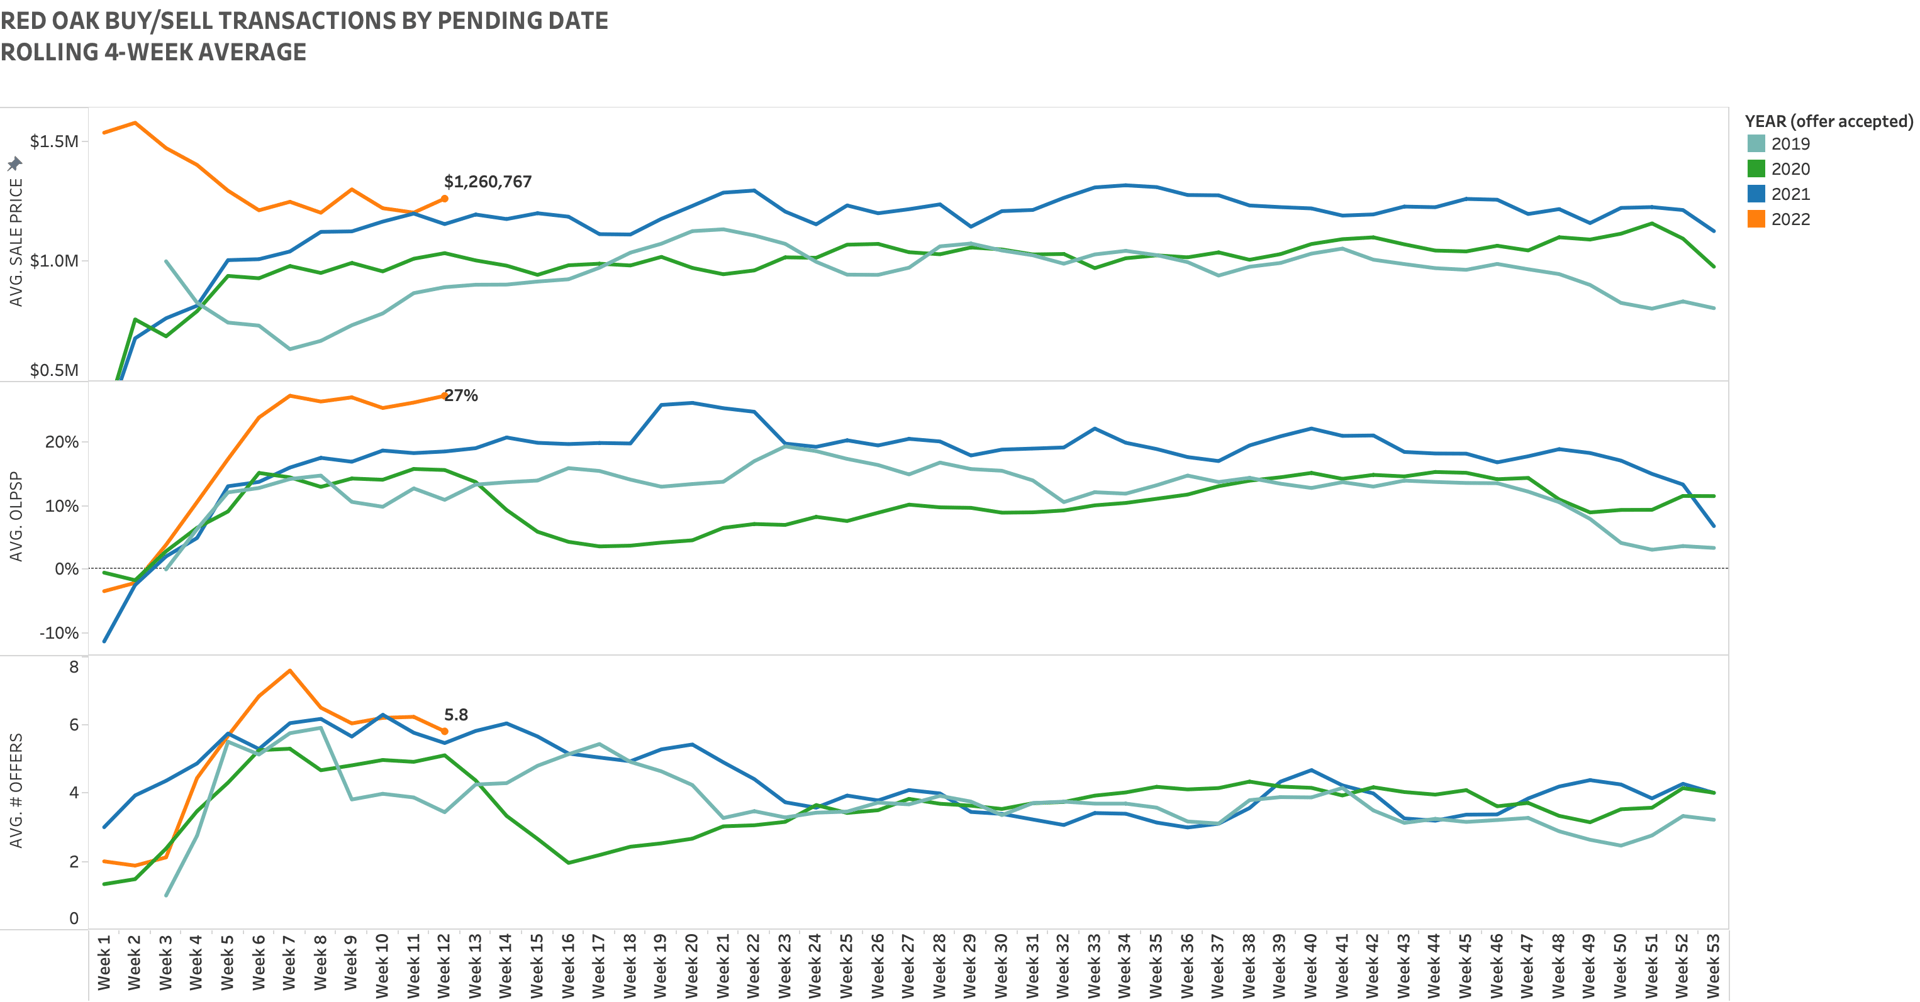
Looking only at Red Oak transactions by offer date, price is up versus last year (up 17% year-over-year) and price over asking is at an all-time high (previous high was 26% in spring of last year). The average number of offers is still high at 5.8, and while it is on the decline, this is consistent with previous years as more inventory hits the market.
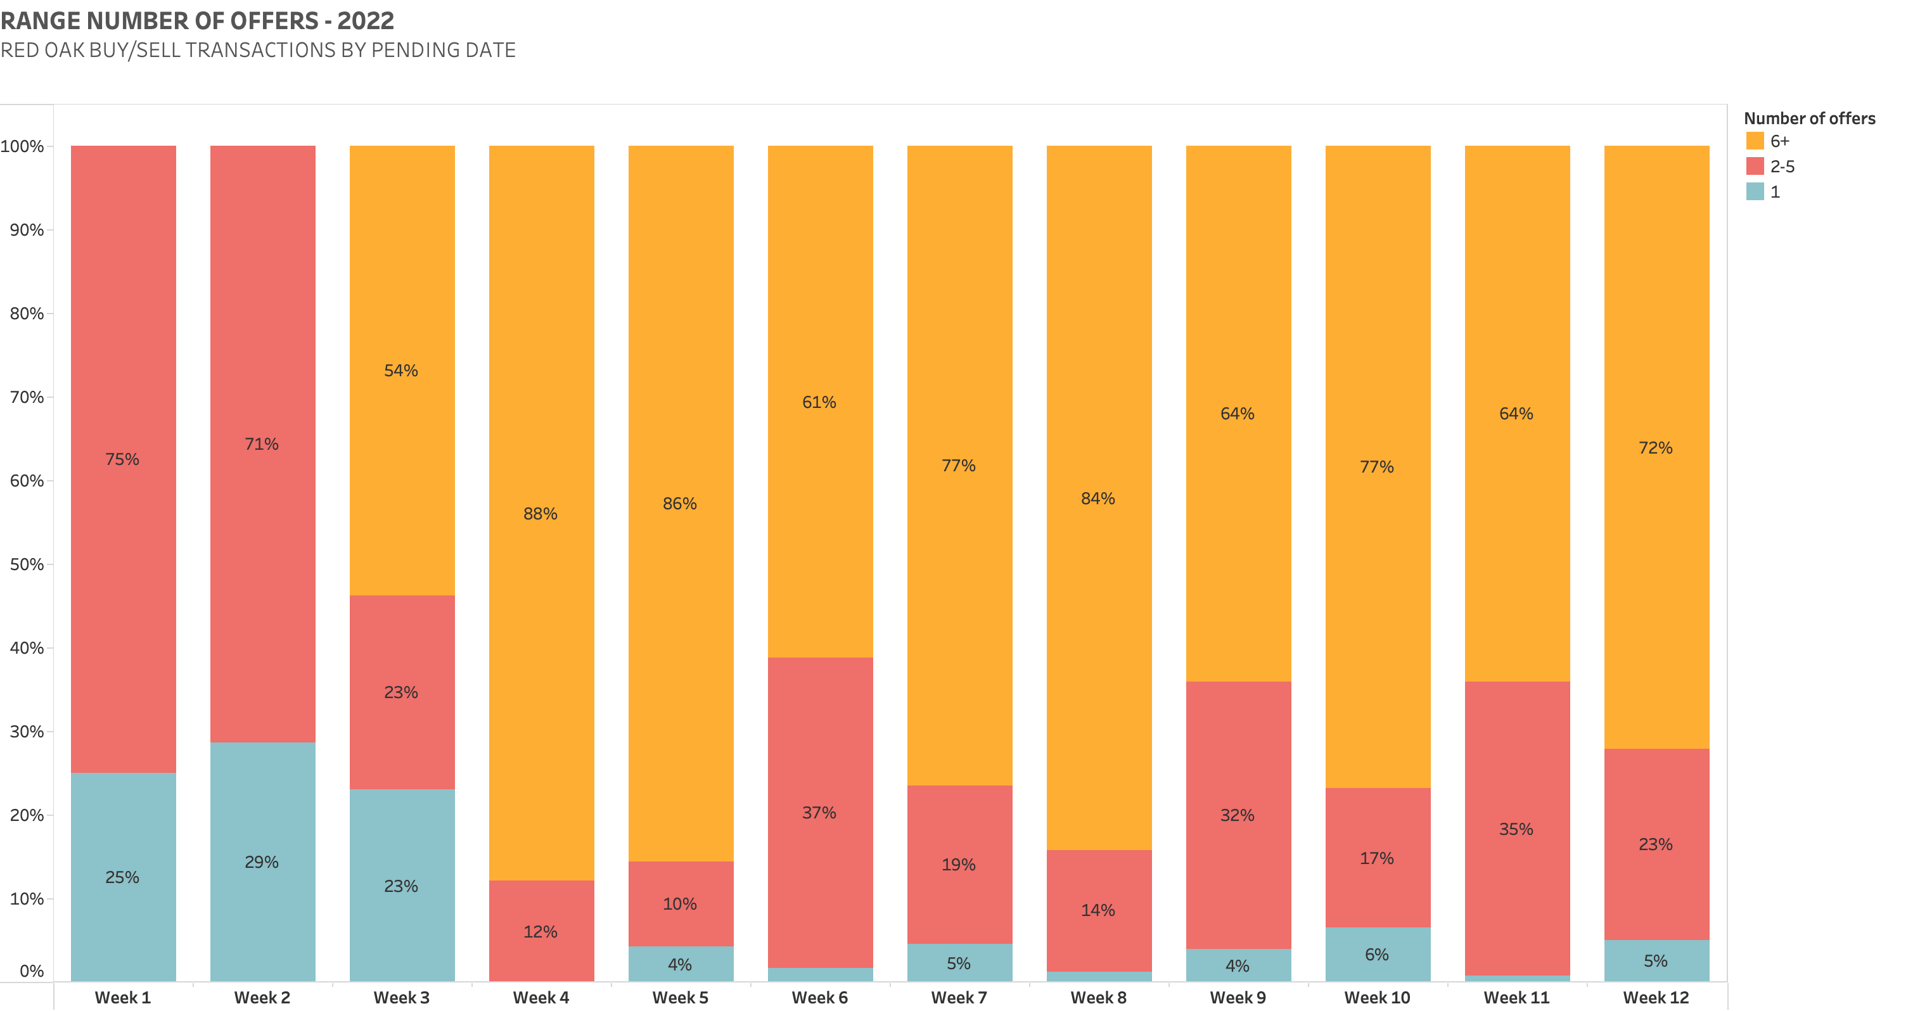
The number of offers written on Red Oak transactions remains high, with 72% receiving 6 or more.
It's too early to tell whether the decrease in contracts is something to be concerned about - we'll need more time and data. If you would like a more specific analysis of the market or have questions regarding real estate, please reach out.