
East Bay market data for Q1 2022 reveal intense competition - at or near record-breaking territory - but it remains to be seen how the spring market will unfold. To get a sense of demand, we focus on a few key metrics:
- Sale price: The price of single family homes rose 11% between Q1, 21 and Q1, 22 to a median of $1,025,000, the highest for the quarter since we began tracking in 1997. This is in addition to the 22% growth experienced between 2020 and 2021. Prices have risen every Q1 since 2016.
- Price over asking: Homes sold an average of 20% over list price. This is the highest for the quarter and near an all-time high for the market. This metric can be a bit “fuzzy” as it is driven by pricing strategy: sellers and their agents often “underlist” a property to encourage offers. But assuming the strategy holds over time, the change in value shows an increasing level of competition.
- Days on market: Properties received a ratified contract within an average of 19 days, another record-breaker for the quarter. Days on market usually sits above 14 days as many listing agents hold open houses over at least two weekends.
A notable surprise is that, while the number of listings remained flat, the number of sold homes did not increase: it fell 13%. A few factors contributed to this decline: the Q1 21 market was unusually active as the world was starting to emerge from the pandemic and people were ready to invest in their living space. The 2022 market appears to be turning towards normalcy, and while it is so far less heated than 2021, it is still one of the most active markets we’ve seen since 2013.
In total, the East Bay market has insufficient supply to meet buyer demand, driving up prices and other key metrics. However, there are forces at play that may negatively affect the spring market. For example, mortgage rates grew at their fastest rate since 1994. What’s more, the yield curve inverted, which has reliably predicted a recession for 60 years, and was driven by high inflation rates (up 8.5% in March, the fastest growth since 1981), record-high food prices, high gas prices, and global socio-political instability caused by the war in Ukraine. On the other hand, there is still much to be optimistic about: Bay Area unemployment rates are near pre-pandemic levels and global tourism is projected to grow 50%. Most importantly, as stated before, there continues to be insufficient housing inventory to meet buyer demand.
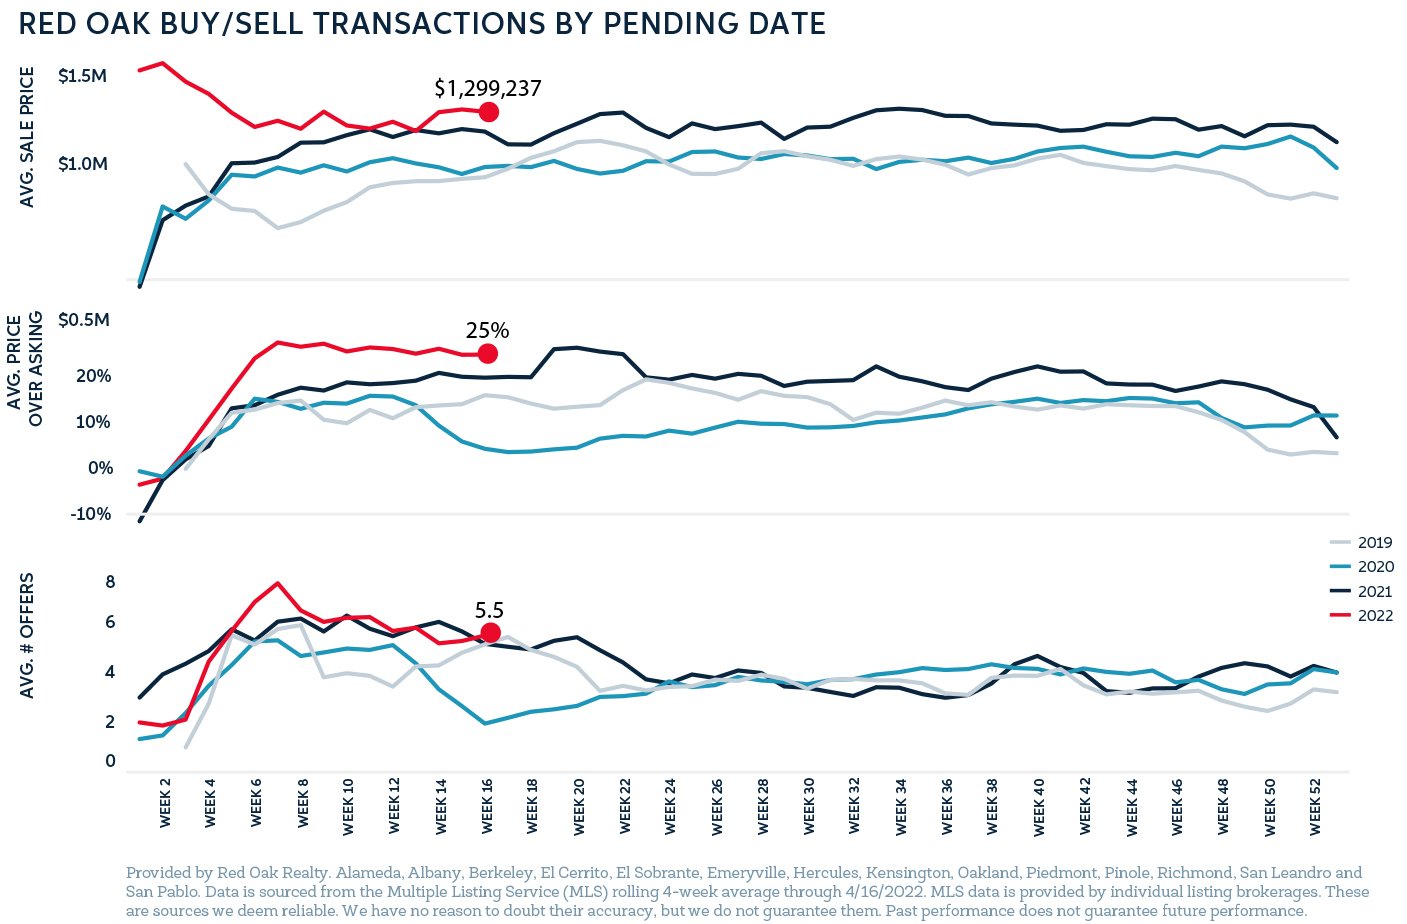
How these forces will balance out in the coming months remains to be seen, but in the meantime, we can look at Red Oak’s internal transaction data by offer date to see how future closings may fair over the next month: homes are selling an average of 25% over list with an average of 5 offers.
Red Oak has deep analytics in the East Bay, as well as data for the entire Bay Area. Reach out if you would like a report that is specific to your real estate goals.